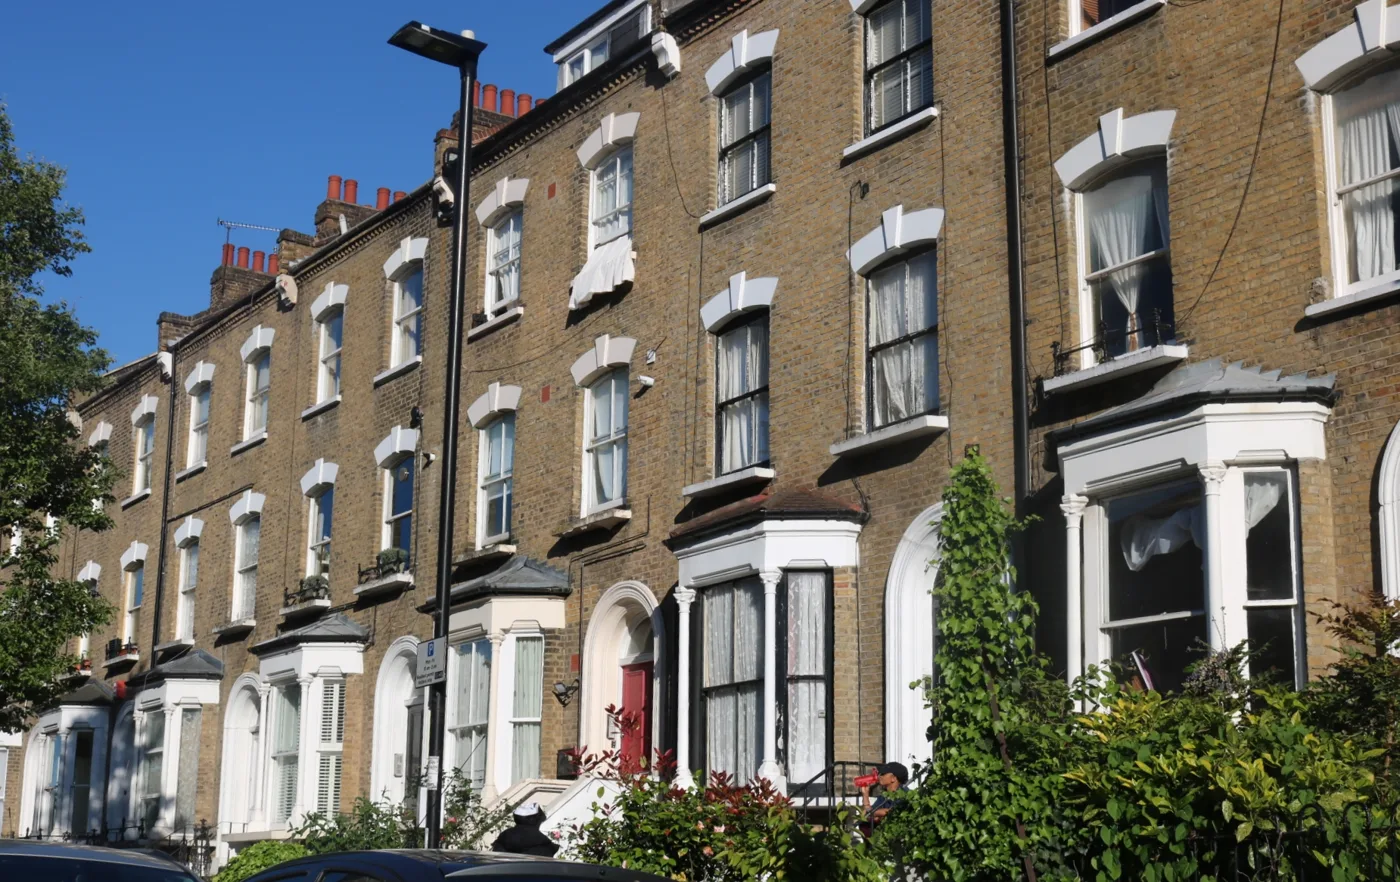

The average Haringey home was worth £633,221 in August, down 1.4% on a year earlier. Flats fell 3.0%, and July's rise has been revised down to 0.3%.
The average home in Haringey was worth £633,221 in August. That is £9,278 less than a year earlier, a fall of 1.4%.
It is the first time since January that the borough’s average has been lower than twelve months before. Over the month from July, prices slipped 0.2%.
The figures come from the UK House Price Index, which HM Land Registry published on 21 October. It counts completed, registered sales, so it runs about two months behind the market. It is a mean average, not a median, so a few very large sales pull it upwards.
July was weaker than first published
Last month we reported that Haringey prices rose 1.0% in the year to July, to £638,690. The Land Registry has since revised July to £634,288, a rise of just 0.3%.
So the slowdown came a month earlier than the first figures showed. Every month of this index is provisional and moves as late sales are registered. August’s figure will move too.
Part of the fall is the comparison. August 2025 was a strong month, with the average at £642,499 and annual growth of 4.7%, so this August is measured against a high point.
Flats fell furthest
Bigger houses still rose over the year. Flats and first-time buyer prices fell:
- Detached: £2,434,471, up 4.6%
- Semi-detached: £1,234,044, up 2.4%
- Terraced: £799,398, up 0.2%
- All types: £633,221, down 1.4%
- First-time buyers: £534,079, down 2.0%
- Flats and maisonettes: £467,608, down 3.0%
Flats are the category most people in the borough buy. We reported a 0.4% fall in flat prices for July; that has since been revised to a 1.2% fall. Detached houses are a small category in Haringey, mostly in Highgate, so treat their figure with care.
14th of 33 London boroughs
Haringey ranked 14th of the 33 London boroughs for annual change. Nine rose, two were unchanged and 22 fell. Kingston upon Thames led London at 4.9%, and Barking and Dagenham came second at 4.7%.
London as a whole fell 2.2% to £554,430. England rose 0.4% to £293,525.
Haringey’s neighbours split the same way:
- Enfield, up 0.8% to £474,855
- Waltham Forest, up 0.7% to £532,212
- Haringey, down 1.4% to £633,221
- Hackney, down 1.6% to £619,408
- Barnet, down 4.4% to £592,892
- Islington, down 8.6% to £654,286
- Camden, down 10.6% to £798,486
Islington is now only £21,000 dearer
A year ago the average Islington home cost £715,818, against £642,499 in Haringey. That was a gap of £73,319.
In August the figures were £654,286 and £633,221, a gap of £21,065. The premium for crossing the borough boundary south has fallen by more than two-thirds in a year.
Haringey flats fell less than flats in most of London. Over the year to August:
| Area | Average flat | Annual change |
|---|---|---|
| Waltham Forest | £390,968 | down 1.3% |
| Enfield | £300,325 | down 1.4% |
| Hackney | £535,923 | down 2.3% |
| Haringey | £467,608 | down 3.0% |
| London | £427,310 | down 5.0% |
| Barnet | £364,239 | down 7.3% |
| Islington | £542,886 | down 9.1% |
| Camden | £656,955 | down 11.4% |
What it means for you
If you are selling a flat, the borough average is now £467,608, 3.0% below a year ago. Prices set from last year’s sales on your street are likely to be too high.
If you are buying, the first-time buyer average fell 2.0% to £534,079. That covers the whole borough, from Highgate to Northumberland Park, so homes in N8 and N10 will usually cost more. Our Crouch End house prices page has the local detail.
If Haringey was your compromise on price, the gap with Islington is less than a third of what it was a year ago. It is worth running the numbers on both before you commit.
If you are appealing your council tax band, this index is not evidence. Bands rest on values at 1 April 1991. Our council tax bands page explains what each band costs this year.
One borough average cannot tell you what is happening on your street. Treat it as the weather, not the forecast for your postcode.
Sources
- UK House Price Index, Haringey, August 2026, HM Land Registry, with the underlying open data, for the borough average, the annual and monthly change and the figures by property type.
- UK House Price Index for August 2026, GOV.UK, published 21 October 2026, for the release date.
- The same UKHPI dataset, checked 24 October 2026, for every London borough, London and England in August 2026; for Haringey in August 2025 and Islington in August 2025; for the revised Haringey July 2026 figure; and for Haringey’s monthly annual change from September 2025 to August 2026 in the chart.
Have your say