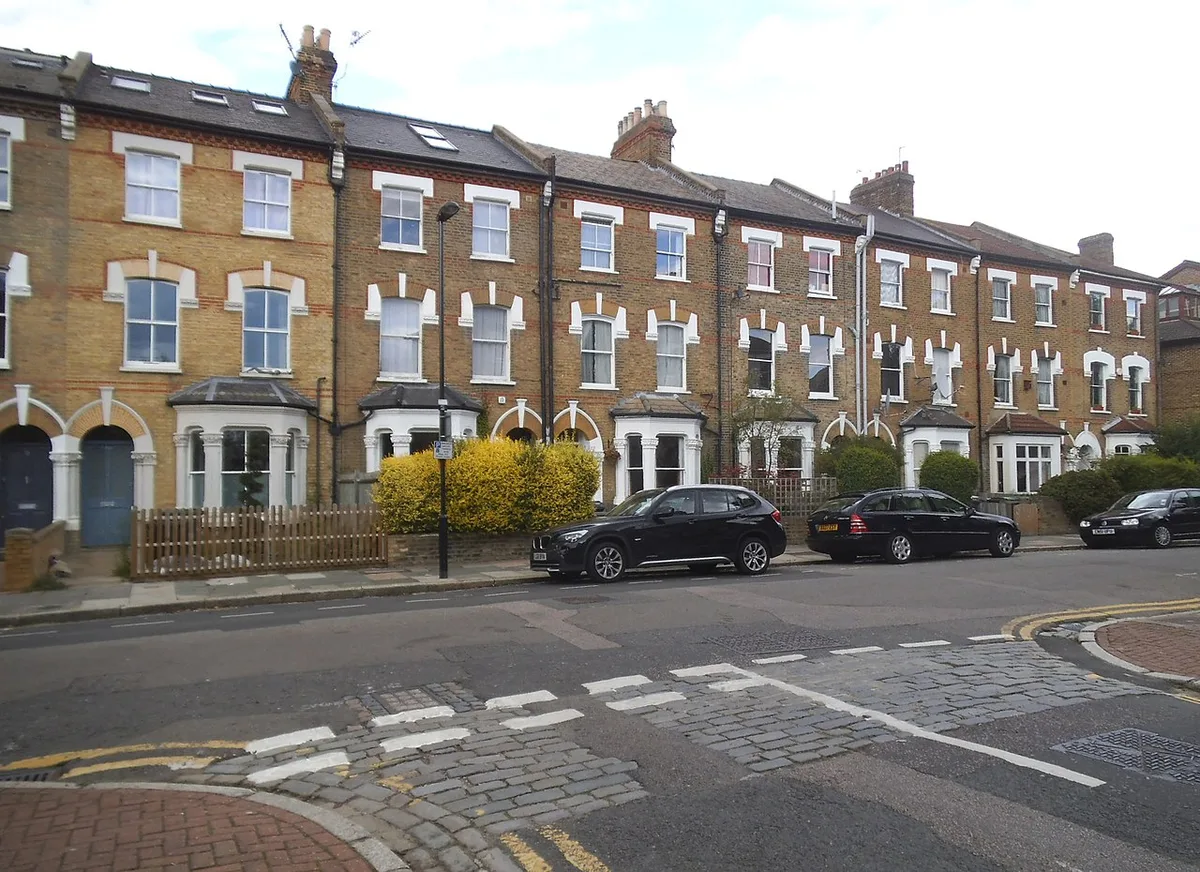

A terraced house in Crouch End sold for a median £1,536,250 last year, a flat for £542,500. Every Haringey postcode sector, from Land Registry records.
Every completed sale in England and Wales is registered and published, so what homes here actually change hands for is a matter of record rather than a matter of opinion. This page reads those records for Haringey: the borough average, the year’s completed sales broken down by postcode sector, and the one split that matters more than any of the geography.
That split is not Crouch End against Tottenham. It is flats against houses. In the N8 8 postcode sector, the streets either side of Crouch End Broadway, the median flat sold for £542,500 last year and the median terraced house for £1,536,250. Those are neighbours on the same road, and there is very nearly a million pounds between them.
The headline figure
The average home in Haringey sold for £634,444 in June 2026, the most recent month published in the UK House Price Index. That is up 2.5% over the year, a gain of £15,386.
That rise is the part worth pausing on, because London as a whole went the other way. Across Greater London prices fell 2.5% over the same year. Fourteen of the 33 London boroughs rose and 19 fell. Haringey was the fifth strongest, behind Barking and Dagenham (+4.3%), Havering (+3.9%), Redbridge (+3.6%) and Kingston upon Thames (+2.9%). All four of those are cheaper boroughs, which makes Haringey the most expensive London borough that rose at all.
The contrast with the boroughs Haringey actually touches is sharper still:
| Area | Average price | Annual change |
|---|---|---|
| Camden | £833,067 | −7.1% |
| Islington | £673,384 | −8.1% |
| Haringey | £634,444 | +2.5% |
| Hackney | £605,442 | +0.4% |
| Barnet | £603,753 | −2.9% |
| Greater London | £553,870 | −2.5% |
| Waltham Forest | £522,743 | +2.5% |
| Enfield | £471,019 | +0.3% |
| England | £293,262 | +1.8% |
Islington and Camden are the two boroughs a great many people in N4, N6 and N8 would move to if money were no object. Both fell by more than 7% while Haringey rose. The gap between Haringey and Islington has closed from £113,941 to £38,940 in a year. Haringey has also overtaken Barnet, which was £2,430 dearer in June 2025 and is now £30,691 cheaper.
None of that means the borough is at a record. Haringey’s highest month in this cycle was £646,258 in September 2025, and June 2026 sits 1.8% below it. Prices also fell 0.5% between May and June. The honest description of the last twelve months is a borough that has moved sideways between roughly £633,000 and £646,000 while much of inner London slid.
What it means for you
If you are buying, the borough is not getting cheaper the way Islington and Camden are, so waiting is costing you here in a way it is not a mile south. The lever that actually moves the price is not which neighbourhood you pick, it is whether you buy a flat or a house. See the table further down: in Crouch End that choice is worth about £994,000.
If you are selling a flat, note that flats were the weakest category in the borough, up just 1.5% over the year against 4.0% for terraced houses. A 2025 valuation on a flat is probably still about right; on a house it may be low.
If you are staying put, your home is worth a little more in cash terms than a year ago and slightly less than it was last September.
Prices by property type
Borough averages for June 2026 from the UK House Price Index, with the annual change alongside:
- Detached houses: £2,397,049, up 3.1%. A small and very expensive category, concentrated in Highgate and the top of Muswell Hill.
- Semi-detached houses: £1,214,465, up 2.6%.
- Terraced houses: £792,826, up 4.0%. The strongest category in the borough, and by some distance the one most people are buying.
- Flats and maisonettes: £472,466, up 1.5%. Barely moved, and this is what more than half of everything sold here is.
The same data splits buyers rather than buildings. A first-time buyer paid an average of £536,916 in June 2026, up 2.5%. A former owner occupier paid £800,695, up 2.7%. The £263,779 between them is the size of the step from a first flat to a family house in this borough, and it is growing.
What each part of Haringey actually sells for
This is where the borough average stops being useful.
The table below is our own analysis of 2,066 residential sales recorded in Haringey that completed between 1 July 2025 and 30 June 2026, taken from HM Land Registry Price Paid data. It shows the median, the middle sale, which is far less distorted by one enormous Highgate house than an average is. The Haringey median over that period was £550,000.
A note on the postcodes before the numbers, because in this borough it matters more than most. Every single Haringey outcode is shared with a neighbouring council. N8 runs into Islington, N10 and N2 into Barnet, N4 and N15 into Islington and Hackney, N22 and N11 into Enfield, N17 into Enfield and Waltham Forest, and N6 four ways. Only the sales the Land Registry records in the Haringey district are counted here, which is why the N2, N11 and N13 rows are small: those are the slivers of Fortis Green, Bounds Green and Palmers Green that fall on this side of the boundary, not whole postal districts.
| Postcode | Main places | Median sold price | Sales |
|---|---|---|---|
| N10 | Muswell Hill, Fortis Green | £750,000 | 227 |
| N2 | Fortis Green (Barnet boundary sliver) | £694,000 | 32 |
| N6 | Highgate | £685,000 | 161 |
| N4 | Stroud Green, Harringay, Finsbury Park side | £615,000 | 199 |
| N8 | Crouch End, Hornsey, Harringay | £597,000 | 419 |
| N11 | Bounds Green (Enfield boundary sliver) | £585,000 | 42 |
| N22 | Wood Green, Alexandra Park, Bounds Green | £537,500 | 287 |
| N15 | South Tottenham, Seven Sisters, St Ann's, West Green | £512,500 | 314 |
| N17 | Tottenham, Tottenham Hale, Northumberland Park | £440,000 | 383 |
N8 is the district most readers of this site live in, and it is also the one the district average serves worst. It contains both the most expensive sector in the west of the borough and one of the cheaper ones. That is the next table.
Down to the postcode sector
Split the districts into sectors and the range runs from £340,000 to £862,913. These are the sectors with at least fifteen recorded Haringey sales in the year, with the wards each one mostly covers.
| Sector | Mostly | Median | Sales |
|---|---|---|---|
| N10 2 | Alexandra Park and Fortis Green | £862,913 | 56 |
| N22 7 | Alexandra Park and the Woodside edge | £860,000 | 62 |
| N8 8 | Crouch End, either side of the Broadway | £842,500 | 94 |
| N10 3 | Muswell Hill | £755,000 | 113 |
| N6 4 | Highgate, north of the Village | £720,000 | 39 |
| N6 5 | Highgate, Archway Road side | £670,000 | 122 |
| N8 9 | Crouch End south and Hornsey | £652,500 | 102 |
| N4 1 | Harringay and Hermitage & Gardens | £650,000 | 97 |
| N15 6 | South Tottenham and Seven Sisters | £650,000 | 77 |
| N4 4 | Stroud Green | £627,500 | 72 |
| N11 2 | Bounds Green | £585,000 | 42 |
| N15 3 | St Ann's and West Green | £575,000 | 77 |
| N4 3 | Stroud Green, Islington boundary | £558,750 | 30 |
| N8 0 | Harringay and Noel Park | £536,000 | 103 |
| N22 6 | Noel Park and Wood Green centre | £512,500 | 101 |
| N22 5 | Woodside and White Hart Lane | £507,500 | 76 |
| N10 1 | Fortis Green, Barnet boundary | £506,500 | 58 |
| N8 7 | Hornsey | £499,000 | 120 |
| N15 5 | Seven Sisters and St Ann's | £485,000 | 63 |
| N17 7 | White Hart Lane | £480,000 | 38 |
| N17 6 | West Green and Tottenham Central | £475,000 | 151 |
| N22 8 | Woodside and Bounds Green | £458,750 | 48 |
| N15 4 | Tottenham Central and South Tottenham | £455,000 | 97 |
| N17 9 | Tottenham Hale | £430,000 | 103 |
| N17 0 | Northumberland Park | £402,500 | 58 |
| N17 8 | Bruce Castle | £340,000 | 33 |
Two things stand out. N8 splits almost in half: N8 8 at £842,500 against N8 7 at £499,000, a £343,500 gap inside one postal district, roughly the distance from the Broadway down Tottenham Lane. And N22 7, which most people would call Alexandra Park rather than Wood Green, is the second dearest sector in the borough while N22 6 a mile away is £347,500 cheaper.
The gap that actually matters
Sector medians mix flats and houses together, and in west Haringey that mixing hides more than it shows. Here is the same year of sales, split by what was actually bought:
| Sector | Mostly | Flat | Terraced house | The step |
|---|---|---|---|---|
| N10 3 | Muswell Hill | £612,500 | £1,749,000 | £1,136,500 |
| N6 5 | Highgate | £625,000 | £1,568,275 | £943,275 |
| N8 8 | Crouch End | £542,500 | £1,536,250 | £993,750 |
| N8 9 | Crouch End south, Hornsey | £600,000 | £1,432,000 | £832,000 |
| N22 7 | Alexandra Park | £547,500 | £1,143,000 | £595,500 |
| N8 7 | Hornsey | £412,000 | £832,500 | £420,500 |
| N8 0 | Harringay | £445,000 | £825,000 | £380,000 |
| N15 4 | Tottenham Central | £375,000 | £646,500 | £271,500 |
| N17 0 | Northumberland Park | £300,000 | £442,500 | £142,500 |
Two conclusions follow from that table, and they are the practical ones.
The first is that the flat market and the house market in west Haringey are barely the same market. A flat in Crouch End at £542,500 is dearer than a flat in Harringay by about £100,000. A house in Crouch End is dearer than a house in Harringay by £711,250. If you are trading up within the borough, the neighbourhood premium you pay compounds enormously the moment you buy a whole building.
The second is that the cheapest route to a house in Haringey is east. A terraced house in Northumberland Park at £442,500 costs less than a flat in Muswell Hill. That is not a recommendation, it is simply what the register says.
Streets
On streets with at least eight recorded sales in the year, the highest medians were Victoria Road (£1,232,500 across 12 sales), Mount View Road (£1,150,000 across 10) and The Avenue (£1,032,500 across 8). Ferme Park Road, the spine between Crouch End and Stroud Green, came in at £687,550 across 18 sales, the busiest single street in the year’s records after Shepherds Hill, which recorded 21 sales at a median of £630,000.
At the other end, and reflecting flat-heavy addresses rather than poor streets, Caxton Road recorded 31 sales at a median of £254,924 and Bream Close ten sales at £241,500.
New builds
Only 48 of the 2,066 sales, or 2.3%, were new builds, at a median of £308,196 against £555,000 for existing homes. That gap is not a bargain and it should not be read as one: new-build sales in this borough are heavily weighted towards flats and shared-ownership tranches in the Tottenham regeneration areas, so the figure is describing a different product, not a discount on the same one.
The more striking number is the 2.3% itself. In a borough with a housing target in the thousands, 48 registered new homes changing hands in a year is a very thin pipeline reaching the open market.
Frequently asked questions
What is the average house price in Crouch End?
The official index is published for the whole borough, where the average home sold for £634,444 in June 2026, up 2.5% over the year. For Crouch End itself, completed sales in the N8 8 sector over the year to June 2026 had a median of £842,500, and N8 9 to its south £652,500.
Are Haringey house prices going up or down?
Up, which makes the borough unusual. Prices rose 2.5% in the year to June 2026 while Greater London fell 3.7%, Islington fell 6.4% and Camden fell 6.2%. Only Waltham Forest and Havering rose faster among the 33 London authorities. The borough is still 1.8% below its September 2025 figure of £646,258.
How much is a flat in Crouch End?
The median flat in N8 8 sold for £542,500 over the year to June 2026, across 49 recorded sales. In N8 9 it was £600,000, in Hornsey (N8 7) £412,000 and in Harringay (N8 0) £445,000. Across the borough the average flat was £472,466 in June 2026, up just 1.5%, the weakest category.
What is the cheapest part of Haringey?
N17 8 around Bruce Castle, at a median of £340,000 across 33 sales, followed by Northumberland Park (N17 0) at £402,500 and Tottenham Hale (N17 9) at £430,000. The dearest sector is N10 2 around Alexandra Park and Fortis Green at £862,913.
Why is a house in Crouch End so much more than a flat?
Because most of what sells in N8 is flats: 258 of the 419 recorded N8 sales were flats or maisonettes and only 119 were terraced houses, and a great many of those flats are conversions carved out of the same Victorian terraces. Buying the whole building rather than a floor of it is what the £993,750 step is paying for.
Where can I check what a specific house sold for?
Every completed sale in England and Wales is public. Search a street or address for free on the HM Land Registry Price Paid service.
Related
- Crouch End trains to London: which station you can actually walk to from the Broadway, and what a year of commuting costs on top of the mortgage.
- Crouch End planning news: the borough’s housing target, the state of the Local Plan and where the new homes are meant to go.
- Crouch End roadworks and travel.
Sources
- UK House Price Index, Haringey (ONS and HM Land Registry) for the borough average, property-type and buyer-type figures and the annual changes.
- HM Land Registry UKHPI open data for the June 2026 record, and the matching London, Islington, Camden, Hackney, Barnet, Enfield, Waltham Forest and England comparisons. The September 2025 figure comes from the same series, and the London borough ranking from the equivalent record for all 33 authorities.
- HM Land Registry Price Paid data for the district, sector, street and property-type medians, computed from 2,066 residential sales recorded in the Haringey district completing between 1 July 2025 and 30 June 2026.
- Postcodes.io for the ward names each postcode sector covers, which is how the “mostly” column was written.
Land Registry figures are provisional and revised as more sales are registered. Confirm the latest numbers against the linked sources before making a decision.
Have your say