
Haringey rose 2.5% to £634,444 while London fell 2.5% and Islington 8.1%. It ranks fifth of 33 boroughs and is the dearest of the 14 that rose.
The average home in Haringey was worth £634,444 in June, up £15,386 on a year earlier. That is a rise of 2.5%.
Over the same twelve months London as a whole fell 2.5%. Camden fell 7.1% and Islington fell 8.1%.
The figures are from the UK House Price Index, published by HM Land Registry on 19 August 2026. They cover sales that actually completed and were registered, which is why they run about two months behind the market.
Fifth of 33 boroughs
Fourteen London boroughs rose in the year to June. Nineteen fell. Haringey was the fifth strongest of the 33, though only just: Waltham Forest also rounds to +2.5% and sits a hundredth of a point behind.
The four boroughs above Haringey are Barking and Dagenham (+4.3%), Havering (+3.9%), Redbridge (+3.6%) and Kingston upon Thames (+2.9%). All four are outer London, and all four are cheaper than Haringey.
That is the part worth pausing on. Of the 14 boroughs that rose, Haringey is the most expensive. Rising markets this year have generally been the affordable ones. Haringey is the exception.
The neighbours went three ways
Haringey borders six boroughs. Three rose, three fell, and the spread between them is enormous:
- Waltham Forest, up 2.5% to £522,743
- Hackney, up 0.4% to £605,442
- Enfield, up 0.3% to £471,019
- Barnet, down 2.9% to £603,753
- Camden, down 7.1% to £833,067
- Islington, down 8.1% to £673,384
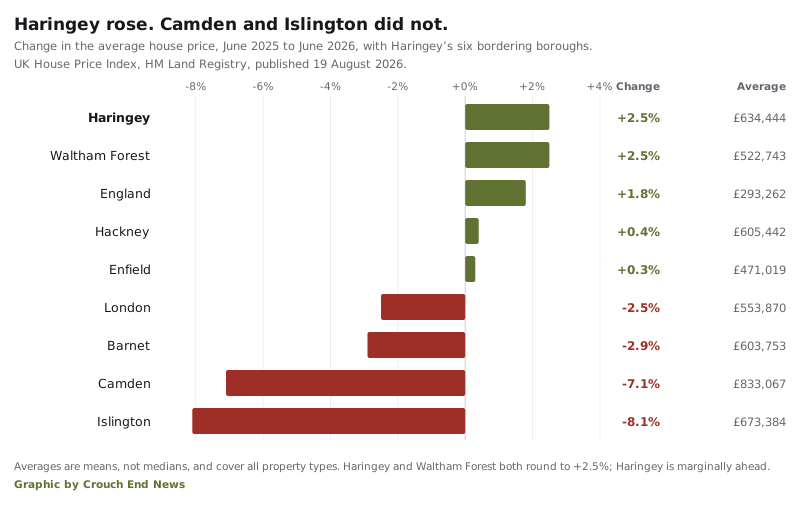
Two boundaries moved noticeably.
The gap to Islington has almost closed. In June 2025 the average Islington home cost £113,941 more than the average Haringey one. In June 2026 it cost £38,940 more. Three quarters of that gap went in a year.
Haringey has overtaken Barnet. A year ago Barnet was the dearer borough, by £2,430. Haringey is now ahead of it by £30,691.
Terraced houses did the work
The rise was not spread evenly across property types. Terraced housing, which is most of what Crouch End, Hornsey and Harringay are built from, led it:
| Type | June 2026 | Change on the year |
|---|---|---|
| Terraced | £792,826 | +£30,338 (+4.0%) |
| Detached | £2,397,049 | +£71,263 (+3.1%) |
| Semi-detached | £1,214,465 | +£31,115 (+2.6%) |
| Flat or maisonette | £472,466 | +£7,005 (+1.5%) |
| All types | £634,444 | +£15,386 (+2.5%) |
Flats moved least, and that matters more here than the percentage suggests. Flats are the bulk of what changes hands in this borough, so the typical Haringey transaction saw far less than 2.5%.
A first-time buyer paid an average of £536,916, up £12,874 on the year. That is also 2.5%, so the entry price has moved in step with everything else rather than opening up.
Three things the headline number hides
The annual figure is genuinely up. Three caveats sit underneath it, and all three are in the same dataset.
1. The month itself went down. Haringey fell 0.5% between May and June. The annual rise is real, but the most recent movement in it was downwards.
2. The borough is still below its peak. Haringey’s highest average in this cycle was £646,258 in September 2025. June 2026 sits 1.8% under that. Prices have been moving sideways in a band of roughly £633,000 to £646,000 for a year now, which is a flat market rather than a rising one.
3. Last month’s number has already changed. The May 2026 average was first published as £633,853. It has now been revised up to £637,321, and May’s annual change with it, from 2.4% to 3.0%. Land Registry revises every month as late registrations come in. Any single month’s figure is provisional, including this one. We had carried the original May figure on our Crouch End house prices page and have updated it.
One more thing to hold in mind: the UK House Price Index average is a mean, not a median. A handful of very large sales pull it upwards. Haringey’s average detached house at £2.4m is doing a lot of work in that £634,444, even though detached houses are a small share of the borough.
What it means for you
If you are selling. The borough number is up on the year but flat over the last nine months, and the most recent month was down. If you bought at the September 2025 peak you are, on these figures, slightly behind. If you are selling a terraced house you are in the strongest part of this market; if you are selling a flat you are close to where you were a year ago.
If you are buying. The direction of travel across the boundary is the useful signal. Islington and Camden have fallen hard while Haringey has not, so the premium for crossing south has shrunk sharply. If you were priced out of Islington a year ago, the gap you were facing is now about a third of what it was.
If you want a real number for your street. Do not use this one. A borough average spans Highgate and Northumberland Park, and the difference between them is larger than the difference between boroughs. Our Crouch End house prices page breaks the same Land Registry data down to postcode sector, where the median in N8 8 and the median in N17 0 are more than £700,000 apart.
If you want to check it yourself. Land Registry’s UK House Price Index tool is free and lets you pick any local authority and any month. The next release, covering July 2026, is due on 16 September.
Related
- Crouch End house prices: the same data by postcode sector, plus median sold prices by street and property type.
- Crouch End planning news: what is being built, and where the borough’s new supply is going.
- Crouch End roadworks and travel: the Crouch Hill closure and this week’s bus diversions.
- Crouch End trains to London: the commute that underpins a lot of these prices.
Sources
- UK House Price Index, Haringey, June 2026, HM Land Registry, published 19 August 2026, for the £634,444 average, the 2.5% annual change, the 0.5% monthly fall and the breakdown by property type and first-time buyer.
- UK House Price Index, Haringey, June 2025 for the £619,058 year-ago average from which every change here is calculated.
- UK House Price Index, Haringey, September 2025 for the £646,258 cycle peak, and May 2026 for the revised £637,321.
- The same monthly series for all 33 London boroughs, London and England, for the ranking, the count of risers and fallers, and every neighbouring borough figure.
- About the UK House Price Index, HM Land Registry, for the mean methodology and the monthly revision policy.
Averages are means and cover all property types. Land Registry revises recent months as sales are registered, so figures for June 2026 will change.
Have your say